ESSAY 23
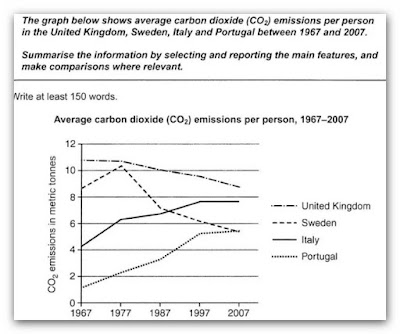
The graph informs about emissions of CO2 in four European
countries namely United Kingdom, Portugal, Sweden, and Italy in the period of
1967 to 2007.
It is apparent from the graph that two countries, Portugal
and Italy, shared the same upward trend over the years. Portugal had gradually
increased their CO2 emissions from 1.7 to 3.7 in 20 years time before slightly
rose by 1.7 metric tonnes in 1997. Italy started from 4.3 metric tonnes in 1967
and reached the peak of 7.8 before it levelled off the way Portugal did in the
last decade of the periods.
UK had successfully maintained the decrease of CO2 emissions
over the years. It started at 11 but then ended the periods at 8.5 metric
tonnes, a drop of 2.5 tonnes in 40 years. In addition, although Sweden
initially experienced a rise in the first decade by 1.7 tonnes, from 8.5 in
1967 to 10.2 in 1977, it then drastically plunged its emission rate at merely 6
tonnes in 1997 and then it continued with a slight drop in the last decade.
It can be said that although they had different start, both
Sweden and the United Kingdom ended up with similar downward trends. On the
other hand, Italy and Portugal showed remarkably similar increasing trends for
40 years.

Comments
Post a Comment